티스토리 뷰

MNIST 데이터베이스 (Modified National Institute of Standards and Technology database)
- 손으로 쓴 숫자들로 이루어진 대형 데이터 베이스
- 기계학습분야의 트레이닝 및 테스트에 널리 사용된다
유명한 MNIST 데이터를 사용한 코드이다.
인터넷에는 분류만 많이 있지 regression은 없어 구현해 보았다.

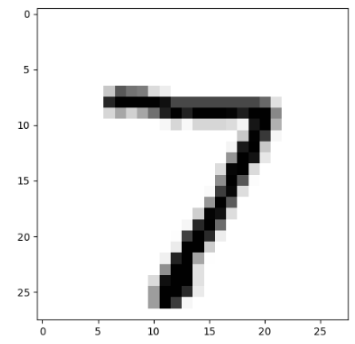
결과값 [[6.7332497]]
눈에 보이는 값 7
====> 오차가 별로 나지 않는다.
<추가>
전체코드 github
https://github.com/YoujeongPark/mnist_regression_ex
YoujeongPark/mnist_regression_ex
Contribute to YoujeongPark/mnist_regression_ex development by creating an account on GitHub.
github.com
|
1
2
3
4
5
6
7
8
9
10
11
12
13
14
15
16
17
18
19
20
21
22
23
24
25
26
27
28
29
30
31
32
33
34
35
36
37
38
39
40
41
42
43
44
45
46
47
48
49
50
51
52
53
54
55
56
57
58
59
60
61
62
63
64
65
66
67
68
69
70
71
72
73
74
75
76
77
78
79
80
81
82
83
84
85
86
87
88
89
90
91
92
93
94
95
96
97
98
99
100
101
102
103
104
105
|
#Regression example using by Keras
import warnings
warnings.simplefilter(action='ignore', category=FutureWarning)
import sys
import tensorflow as tf
import keras
from keras.models import Sequential
from keras.layers import Dense, Dropout, Flatten
from keras.layers.convolutional import Conv2D, MaxPooling2D
import numpy as np
import matplotlib.pyplot as plt
(x_train, y_train), (x_test, y_test) = keras.datasets.mnist.load_data()
print("X.shape", type(x_train))
print("Y.shape", type(y_train))
print("X.shape", x_train.shape)
print("Y.shape", y_train.shape)
# 값은 0부터 9까지 라벨링이 되어 있음
# All y values were labeled already
# for i in range(0,len(y_train)):
# print(y_train[i])
img_rows = 28
img_cols = 28
input_shape = (img_rows, img_cols, 1) #(28,28,1)
x_train = x_train.reshape(x_train.shape[0], img_rows, img_cols, 1) #(60000,28,28,1)
x_test = x_test.reshape(x_test.shape[0], img_rows, img_cols, 1) #(60000,28,28,1)
x_train = x_train.astype('float32') / 255. #normalization
x_test = x_test.astype('float32') / 255. #normalization
print("len(x_train)",len(x_train)) #60000개
print("len(x_train[0]", len(x_train[0])) #28
print("len(x_train[1]", len(x_train[1])) #28
print("len(x_train[0][0]", len(x_train[0][0])) #28
print("len(x_train[0][0][0]", len(x_train[0][0][0])) #1
print("x_train[0]",x_train[0])
batch_size = 128
num_classes = 10
epochs = 10
# 카테고리일 떄 사용
# y_train = keras.utils.to_categorical(y_train, num_classes)
# y_test = keras.utils.to_categorical(y_test, num_classes)
#회귀일때
y_train = y_train.reshape(len(x_train), 1)
y_test = y_test.reshape(len(x_test), 1)
print(y_train)
model = Sequential()
model.add(Conv2D(32, kernel_size=(5, 5), strides=(1, 1), padding='same',
activation='relu',
input_shape=input_shape))
model.add(MaxPooling2D(pool_size=(2, 2), strides=(2, 2)))
model.add(Conv2D(64, (2, 2), activation='relu', padding='same'))
model.add(MaxPooling2D(pool_size=(2, 2)))
model.add(Dropout(0.25))
model.add(Flatten())
model.add(Dense(50, activation='relu'))
model.add(Dense(1))
model.compile(optimizer='adam', loss='mse',metrics=["accuracy"])
#hist = model.fit(x_train, y_train, validation_data=(x_test, y_test))
hist = model.fit(x_train, y_train, validation_data=(x_test, y_test), epochs=epochs,batch_size=batch_size)
plt.figure(figsize=(12,8))
plt.plot(hist.history['loss'])
plt.plot(hist.history['val_loss'])
plt.plot(hist.history['acc'])
plt.plot(hist.history['val_acc'])
plt.legend(['loss','val_loss', 'acc','val_acc'])
plt.show()
#Score
score = model.evaluate(x_test, y_test, verbose=0)
print('Test loss:', score[0])
print('Test accuracy:', score[1])
#Test in order to compare real value and the result.
n = 0
plt.imshow(x_test[n].reshape(28, 28), cmap='Greys', interpolation='nearest')
plt.show()
print(model.predict(x_test[n].reshape(1, 28, 28, 1)))
|
cs |
'인공지능 > 딥러닝' 카테고리의 다른 글
| 딥러닝(Deep Learning) - CNN 기본개념 (0) | 2019.10.18 |
|---|---|
| [1] tensorflow - 헷갈리는것 shape 정리 (0) | 2019.09.11 |
| [1] Machine learning basic (0) | 2019.09.05 |
| [2] Keras - 기본 CNN regression 구현 (0) | 2019.09.05 |
| [1] Keras - 기본 mlp regression 구현 (0) | 2019.09.05 |
댓글
